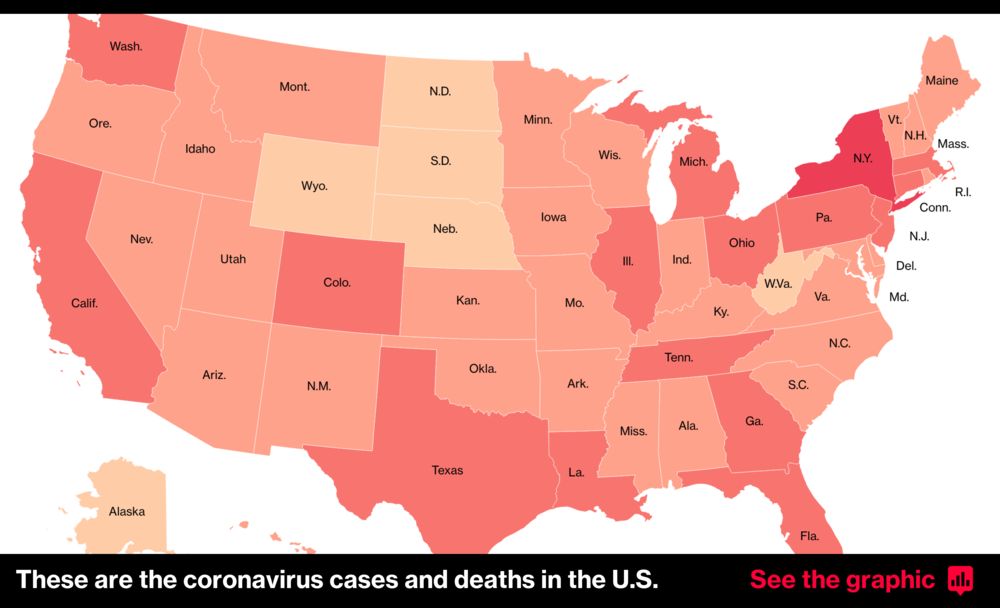
The graphics on this page are based on daily updates from the state released around 10 every morning. Dates indicate when information was reported. The column charts in the first visualization are most useful for evaluating trends. Since the results of many tests aren’t available immediately, numbers do not necessarily reflect the current level of spread of the virus. Feedback? Email [email protected].
Day by day: Confirmed Maryland cases, hospitalizations, deaths, testing volume and positivity rate

